TradeVision
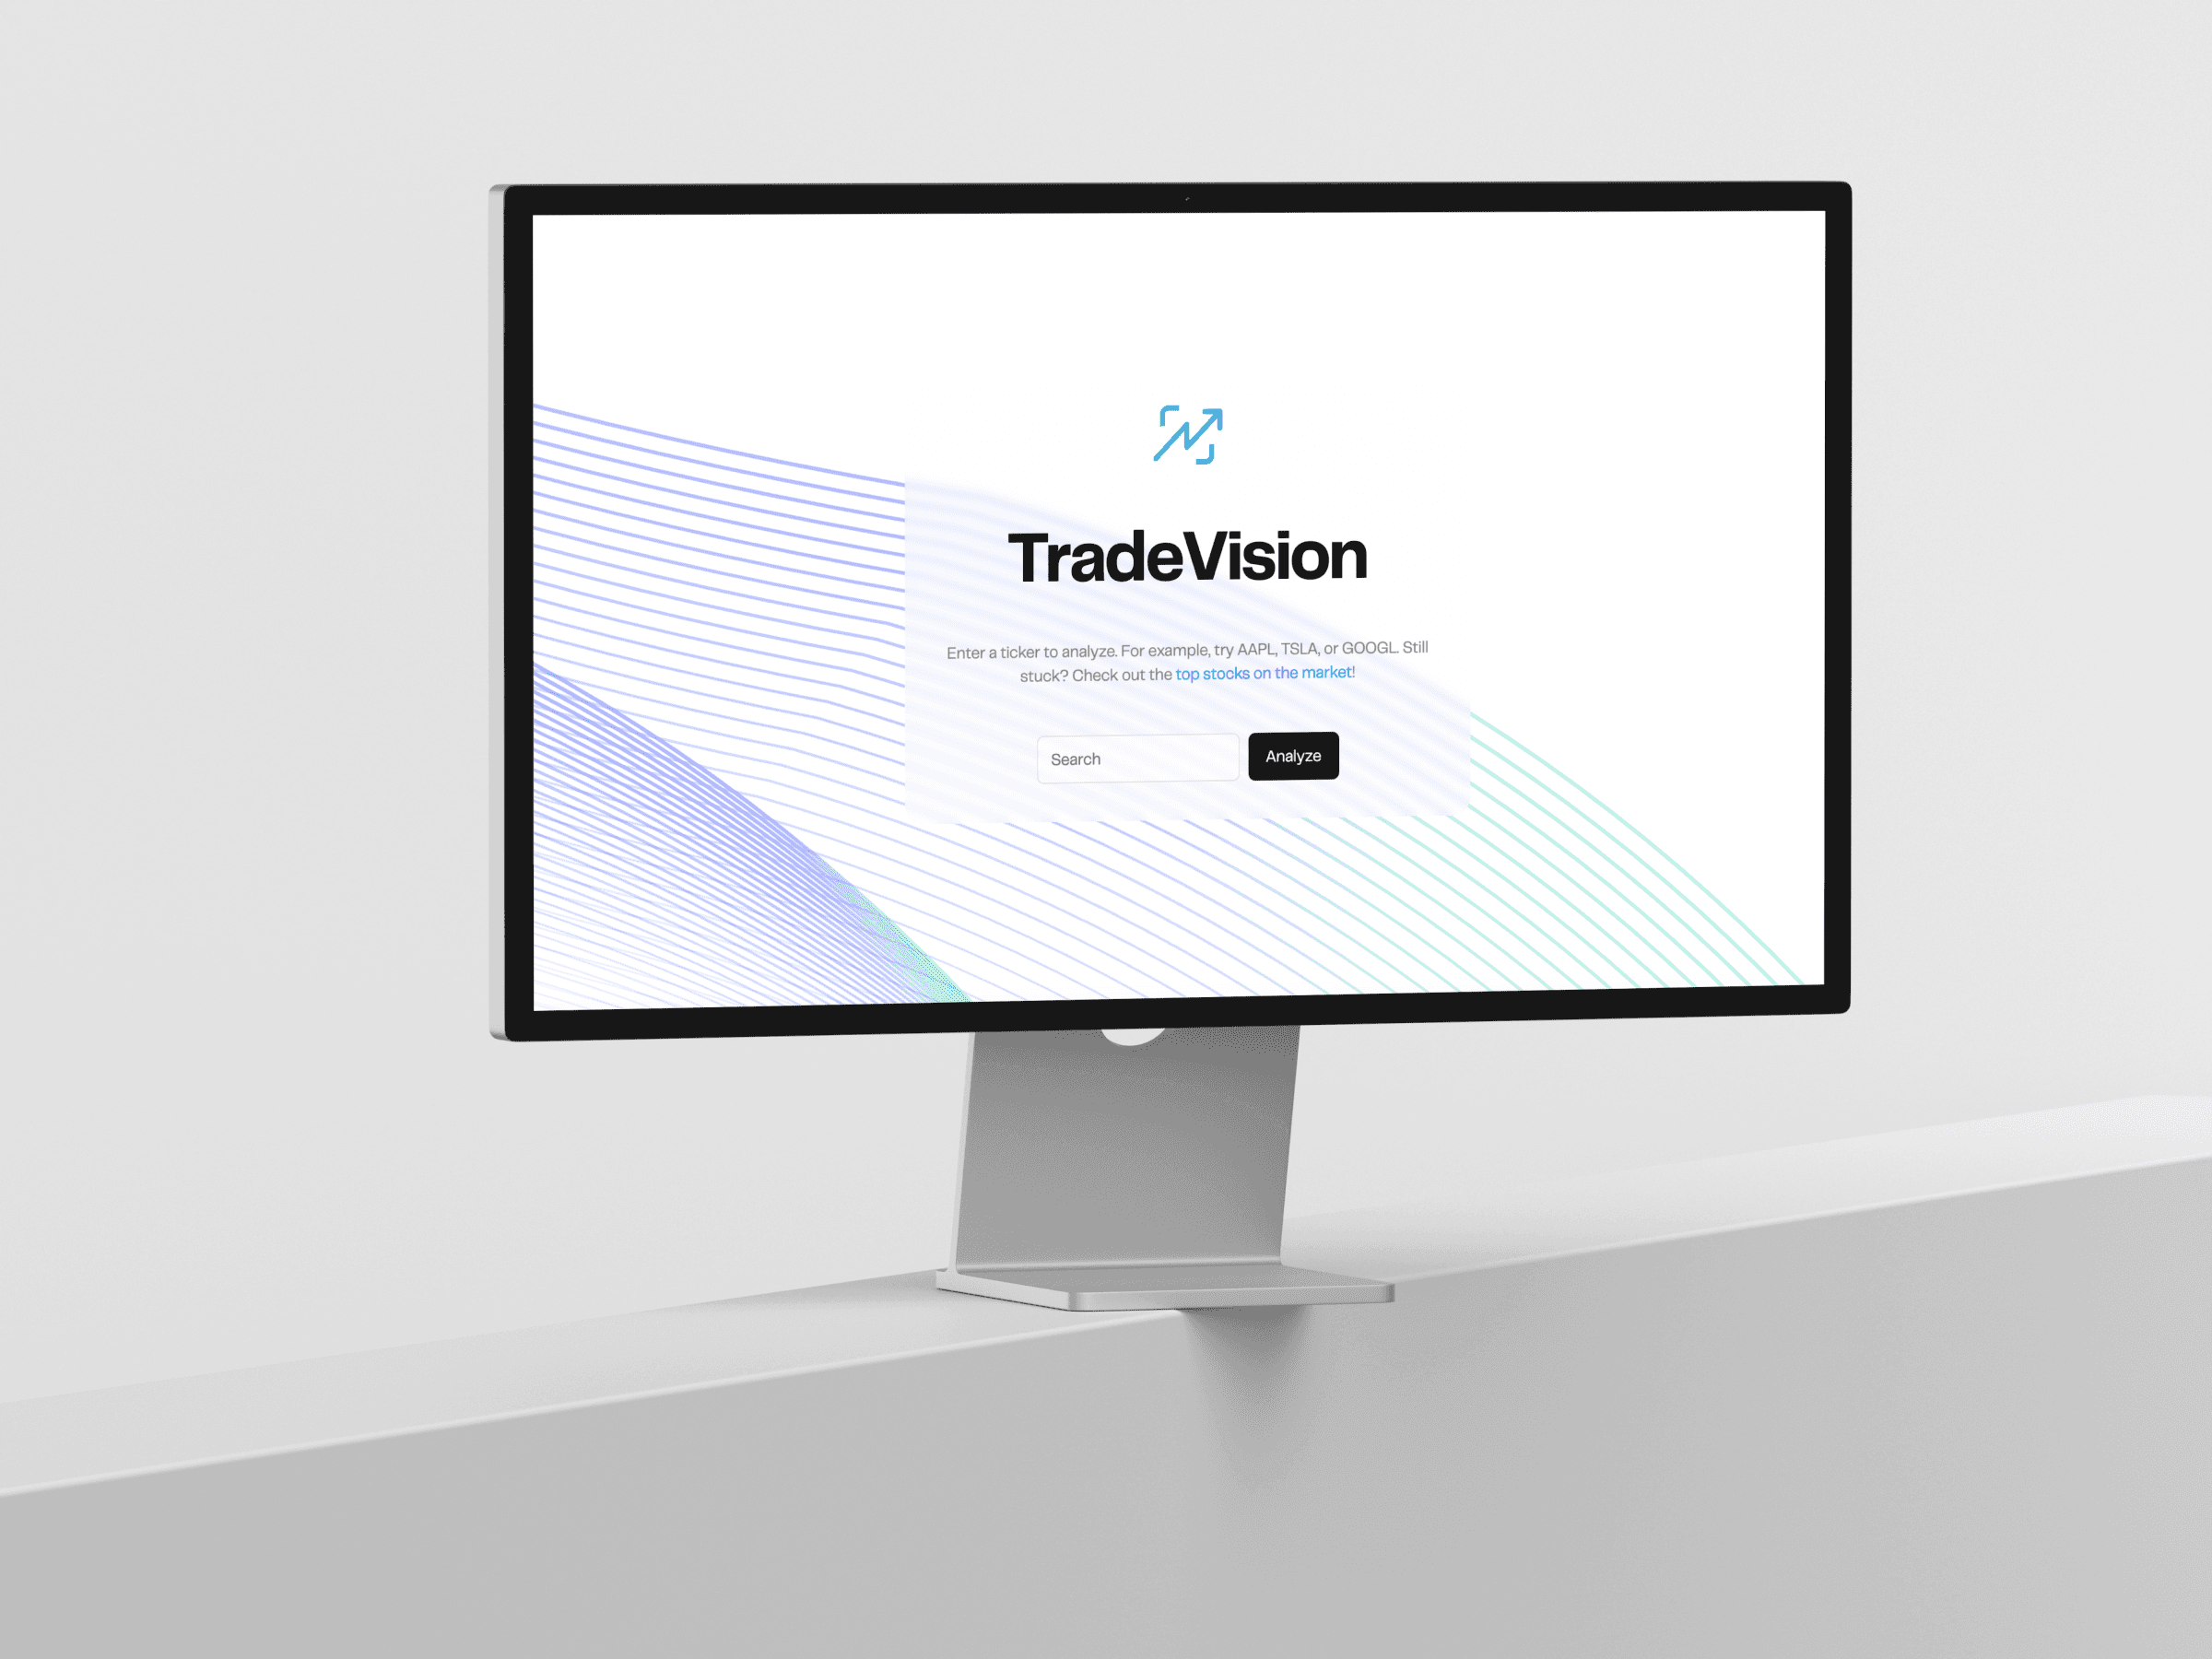
A web app running sentiment analysis on social media and news articles to help make better investment decisions.
CATEGORY
Full Stack
NAME
TradeVision
DATE
February - May 2025
Project link
LIVE WEBSITE
For my Projects in Programming class at NYU Stern, I created a functional web application with my team that analyzes stocks and gives a metric score based on their presence in the news and social media to help beginner investors make informed decisions for stock investments.
This project centers around the development of a Personalized Investment Insights Platform—a web-based tool designed to empower investors by delivering intelligent, real-time analysis of their portfolios. The platform aims to create a unified environment where users can track companies they’ve invested in or are interested in by aggregating data from a variety of financial APIs. It extracts and presents relevant news, assesses sentiment trends, and visualizes key financial metrics through interactive dashboards. By simplifying complex financial data, the platform helps users—from casual investors to portfolio managers—stay informed and make evidence-based investment decisions.
Web APIs and Data Sources
To ensure a robust and dynamic dataset, my team integrated a wide range of APIs, including:
News API: Provides company-specific, sector-wide, and general market news from established financial news sources.
Finnhub Stock API: Supplies stock-specific news, enabling sentiment analysis.
Reddit API: Enables social sentiment tracking by mining finance-related subreddits to detect retail investor narratives and rumors.
Bluesky API: Brings in sentiment and news from decentralized social media, offering an alternative perspective to Twitter.
Alpha Vantage API: Delivers data on the top 20 gainers, losers, and most actively traded tickers in the U.S. market.
By combining both traditional and alternative data sources, the platform reflects the diverse factors influencing modern financial markets.
Approach and Methodology
The platform is being developed using a modular, data-driven architecture to ensure flexibility and scalability. The key components include:
Data Aggregation: A backend engine continuously collects real-time and historical data from the integrated APIs based on companies in a user’s portfolio.
Sentiment Analysis: Natural Language Processing (NLP) is applied to news headlines, Reddit posts, and social media updates to assign sentiment scores (positive, neutral, negative) to each company over time.
Visualization Layer: An intuitive dashboard displays visualizations of financial metrics such as stock performance, trading volume, sentiment trends, and correlated market indicators.
User Personalization: The system supports portfolio tracking and delivers targeted insights tailored to the companies each user follows.
Technology Stack
The platform is built using Python Flask for the backend and Next.js for the frontend, deployed via Railway. For UI development, it leverages Tailwind CSS and Shadcn/ui to create interactive, ready-to-use responsive components that contribute to a seamless and modern user experience.